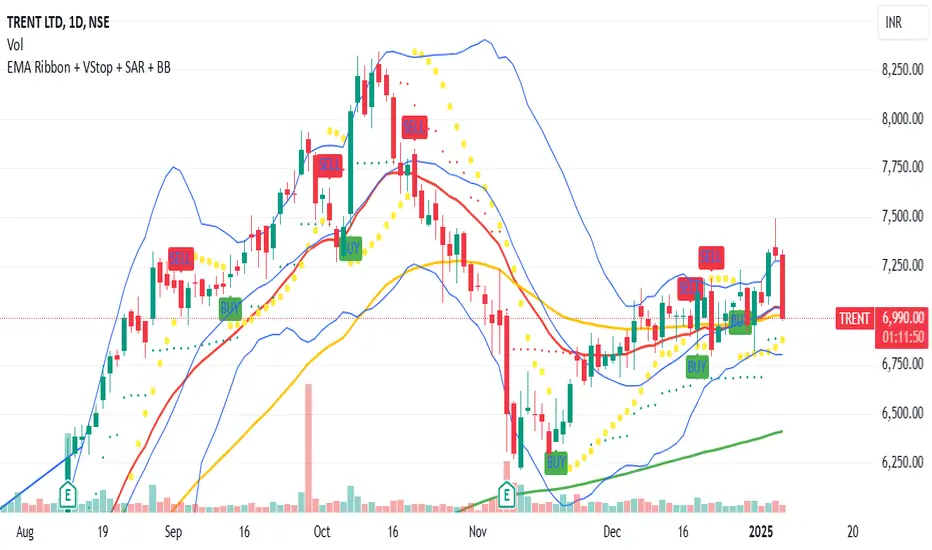
Cari dalam skrip untuk "EMA RIBBON"
Optimized EMA Ribbon Strategy v6 Based on EMA rotations, ADX we create a system of entering trades. Watch out for the sell and buy signals.
BCM Trend Map Pro v3BCM Trend Map Pro v3
Visual trend detection and cycle confirmation system.
The BCM Trend Map is a trend-following and momentum-confirmation indicator designed to clearly detect trend transitions with minimal noise.
It combines a dynamic EMA Ribbon with optional RSI filtering and confirmation logic to reduce false signals, offering a clean, reliable read of market structure and momentum shifts.
Fib OscillatorWhat is Fib Oscillator and How to Use it?
๐ถ 1. Conceptual Overview
The Fib Oscillator is a Fibonacci-based relative position oscillator.
Instead of measuring momentum (like RSI or MACD), it measures where price currently sits between the recent swing high and swing low, expressed as a percentage within the Fibonacci range.
In other words:
It answers: โWhere is price right now within its most recent dynamic range?โ
It visualizes retracement and extension zones numerically, providing continuous feedback between 0% and 100% (and beyond if extended).
๐ถ 2. What the Script Does
The indicator:
Automatically detects recent high and low levels using an adaptive lookback window, which depends on ATR volatility.
Calculates the current priceโs position between those levels as a percentage (0โ100).
Plots that percentage as an oscillator โ showing visually whether price is near the top, middle, or bottom of its recent range.
Overlays Fibonacci retracement levels (23.6%, 38.2%, 50%, 61.8%, 78.6%) as reference zones.
Generates alerts when the oscillator crosses key Fib thresholds โ which can signal retracement completion, breakout potential, or pullback exhaustion.
๐ถ 3. Technical Flow Breakdown
(a) Inputs
Input Description Default Notes
atrLength ATR period used for volatility estimation 14 Used to dynamically tune lookback sensitivity
minLookback Minimum lookback window (candles) 20 Ensures stability even in low volatility
maxLookback Maximum lookback window 100 Limits over-expansion during high volatility
isInverse Inverts chart orientation false Useful for inverse markets (e.g. shorts or inverse BTC view)
(b) Volatility-Adaptive Lookback
Instead of using a fixed lookback, it calculates:
lookback
=
SMA(ATR,10)
/
SMA(Close,10)
ร
500
lookback=SMA(ATR,10)/SMA(Close,10)ร500
Then it clamps this between minLookback and maxLookback.
This makes the oscillator:
More reactive during high volatility (shorter lookback)
More stable during calm markets (longer lookback)
Essentially, it self-adjusts to market rhythm โ you donโt have to constantly tweak lookback manually.
(c) High-Low Reference Points
It takes the highest and lowest points within the dynamic lookback window.
If isInverse = true, it flips the candle logic (useful if viewing inverse instruments like stablecoin pairs or when analyzing bearish setups invertedly).
(d) Oscillator Core
The main oscillator line:
osc
=
(
close
โ
low
)
(
high
โ
low
)
ร
100
osc=
(highโlow)
(closeโlow)
โ
ร100
0% = Price is at the lookback low.
100% = Price is at the lookback high.
50% = Midpoint (balanced).
Between Fibonacci percentages (23.6%, 38.2%, 61.8%, etc.), the oscillator indicates retracement stages.
(e) Fibonacci Levels as Reference
It overlays horizontal reference lines at:
0%, 23.6%, 38.2%, 50%, 61.8%, 78.6%, 100%
These act as support/resistance bands in oscillator space.
You can read it similar to how traders use Fibonacci retracements on charts, but compressed into a single line oscillator.
(f) Alerts
The script includes built-in alert conditions for crossovers at each major Fibonacci level.
You can set TradingView alerts such as:
โOscillator crossed above 61.8%โ โ possible bullish continuation or breakout.
โOscillator crossed below 38.2%โ โ possible pullback or correction starting.
This allows automated monitoring of fib retracement completions without manually drawing fib levels.
๐ถ 4. How to Use It
๐ธ Visual Interpretation
Oscillator Value Zone Market Context
0โ23.6% Deep Retracement Potential exhaustion of a down-move / early reversal
23.6โ38.2% Shallow retracement zone Possible continuation phase
38.2โ50% Mid retracement Neutral or indecisive structure
50โ61.8% Key pivot region Common trend resumption zone
61.8โ78.6% Late retracement Often โlast pullbackโ area
78.6โ100% Near high range Possible overextension / profit-taking
>100% Range breakout New leg formation / expansion
๐ธ Practical Application Steps
Load the indicator on your chart (set overlay = false, so itโs below the main price chart).
Observe oscillator position relative to fib bands:
Use it to determine retracement depth.
Combine with structure tools:
Trend lines, swing points, or HTF market structure.
Use crossovers for timing:
Crossing above 61.8% in an uptrend often confirms breakout continuation.
Crossing below 38.2% in a downtrend signals renewed downside momentum.
For range markets, oscillator swings between 23.6% and 78.6% can define accumulation/distribution boundaries.
๐ถ 5. When to Use It
During Retracements: To gauge how deep the pullback has gone.
During Range Markets: To identify relative overbought/oversold positions.
Before Breakouts: Crossovers of 61.8% or 78.6% often precede impulsive moves.
In Multi-Timeframe Contexts:
LTF (15Mโ1H): Detect intraday retracement exhaustion.
HTF (4Hโ1D): Confirm major range expansions or key reversal zones.
๐ถ 6. Ideal Companion Indicators
The Fib Oscillator works best when contextualized with structure, volatility, and trend bias indicators.
Below are optimal pairings:
Companion Indicator Purpose Integration Insight
Market Structure MTF Tool Identify active trend direction Use Fib Oscillator only in trend direction for cleaner signals
EMA Ribbon / Supertrend Trend confirmation Align oscillator crossovers with EMA bias
ATR Bands / Volatility Envelope Validate breakout strength If oscillator >78.6% & ATR rising โ valid breakout
Volume Oscillator Confirm retracement strength Volume contraction + oscillator under 38.2% โ potential reversal
HTF Fib Retracement Tool Combine LTF oscillator with HTF fib confluence Powerful multi-timeframe setups
RSI or Stochastic Measure momentum relative to position RSI divergence while oscillator near 78.6% โ exhaustion clue
๐ถ 7. Understanding the Settings
Setting Function Practical Impact
ATR Period (14) Controls volatility sampling Higher = smoother lookback adaptation
Min Lookback (20) Smallest window allowed Lower = more reactive but noisier
Max Lookback (100) Largest window allowed Higher = smoother but slower to react
Inverse Candle Chart Flips oscillator vertically Useful when analyzing bearish or inverse scenarios (e.g. short-side fib mapping)
Recommended Configs:
For scalping/intraday: ATR 10โ14, lookback 20โ50
For swing/position trading: ATR 14โ21, lookback 50โ100
๐ถ 8. Example Trade Logic (Practical Use)
Scenario: Uptrend on 4H chart
Oscillator drops to below 38.2% โ retracement zone
Price consolidates โ oscillator stabilizes
Oscillator crosses above 50% โ pullback ending
Entry: Long when oscillator crosses above 61.8%
Exit: Near 78.6โ100% zone or upon divergence with RSI
For Short Bias (Inverse Setup):
Enable isInverse = true to visually flip the oscillator (so lows become highs).
Use the same thresholds inversely.
๐ถ 9. Strengths & Limitations
โ
Strengths
Dynamic, self-adapting to volatility
Quantifies Fib retracement as a continuous function
Compact oscillator view (no clutter on chart)
Works well across all timeframes
Compatible with both trending and ranging markets
โ ๏ธ Limitations
Doesnโt define trend direction โ must be used with structure filters
Can whipsaw during choppy consolidations
The โlookback auto-adjustโ may lag in sudden volatility shifts
Shouldnโt be used standalone for entries without structural confluence
๐ถ 10. Summary
The โFib Oscillatorโ is a dynamic Fibonacci-relative positioning tool that merges retracement theory with adaptive volatility logic.
It gives traders an intuitive, quantified view of where price sits within its recent fib range, allowing anticipation of pullbacks, reversals, or breakout momentum.
Think of it as a "Fibonacci RSI", but instead of momentum strength, it shows positional depth โ the vibrational location of price within its natural swing cycle.
โก Elite Momentum Pro๐ฏ Key Features
1. Smart Signal Engine
3 Signal Modes: Aggressive, Balanced, Conservative
7-Point Scoring System - Ensures high-quality signals
Anti-Flip Protection - Prevents rapid signal changes
Multiple confirmations: Supertrend, MACD, RSI, EMA alignment, momentum
2. Advanced Risk Management
3 Take Profit Levels (TP1, TP2, TP3) for scaling out
ATR-Based Dynamic Stops - Adapts to volatility
Customizable Risk:Reward (default 2.5:1)
Visual stop and target levels
3. Clean Visual Design
Color-coded price bars based on trend strength
EMA Ribbon (9, 21, 50, 200) for trend clarity
Moving Average Shift [Quantora]Title: Moving Average Shift
Description:
The Moving Average Shift is a dynamic technical analysis tool designed to help traders better visualize trend strength and direction using a combination of customizable moving averages and a volatility-adjusted oscillator.
๐ง Features:
Multi-Type Moving Average Selection
Choose from SMA, EMA, SMMA (RMA), WMA, and VWMA for your main signal line.
ZLSMA Trio
Three Zero-Lag Smoothed Moving Averages (ZLSMA) with adjustable lengths and colors provide a smoother trend-following structure without the delay of traditional MAs.
EMA Ribbon (50/100/200)
Add clarity to long-term trend direction with layered Exponential Moving Averages in key institutional periods.
Volatility-Adjusted Oscillator
A color-changing oscillator calculated from the normalized deviation between price and the selected MA. This helps identify trend shifts and momentum buildups.
Custom MA Line Widths and Styling
Full control over the width and appearance of all MA lines for visual clarity.
Bar & Candle Coloring
Bars and candles dynamically change color based on the relationship between price and the selected MA โ helping you quickly assess bullish/bearish conditions.
๐ How It Helps:
Spot early trend shifts through the oscillator.
Confirm trades using the alignment between ZLSMAs and EMAs.
Quickly assess current trend conditions using color-coded price bars.
4 Time Frame Two EMAs Ribbon Comparison - Tom1traderI had seen something like this on metatrader but not here. Since I use TradingView and not metatrader had some fun with this. Indicates up or down for 4 chosen time Frames and as such helps to see the historical trend. Works best on daily or shorter charts because of load time.
User can choose the length of the two exponential moving averages used on each time frame or use defaults 9 and 15.
User can choose the 4 time frames defaults are (display from top to bottom) 5, 15, 60 and D.
Displays a column of 4 dots or circles for each bar of current chart the top being the shortest time frame.
If the faster exponential moving average is above the slower (uptrend) the dot is green else red.
This is similar (actually what I was originally shooting for but took extra time to figure out time frames on here) to another script of mine that has the same display method but uses a spaced set of Hull Moving Averages on one time frame, you choose the shortest length and the space increment between the averages. One may work better than the other for different markets or trading styles. The other one is here: Have fun trading and keep smiling!
200 SMA with EMA Ribbon (Custom Colors)Simple Moving Average with the longer- time based line analyzing both shorter and longer trends
GutroThis TradingView indicator automatically plots Fibonacci retracement levels based on the dayโs first confirmed swing between the session high and low (9:30 AM โ 4 PM ET). It includes dynamic 0%, 38.2%, 50%, 61.8%, and 100% levels, a shaded golden zone, VWAP bands with standard-deviation envelopes, and a 9/21 EMA ribbon for trend confirmation.
Open Interest-RSI + Funding + Fractal DivergencesIndicator โ โOpen Interest-RSI + Funding + Fractal Divergencesโ
A multi-factor oscillator that fuses Open-Interest RSI, real-time Funding-Rate data and price/OI fractal divergences.
It paints BUY/SELL arrows in its own pane and directly on the price chart, helping you spot spots where crowd positioning, leverage costs and price action contradict each other.
1โPurpose
OI-RSI โ measures conviction behind position changes instead of price momentum.
Funding Rate โ shows who pays to hold positions (longs โ bull bias, shorts โ bear bias).
Fractal Divergences โ detects HH/LL in price that are not confirmed by OI-RSI.
Optional Funding filter โ hides signals when funding is already extreme.
Together these elements highlight exhaustion points and potential mean-reversion trades.
2โInputs
RSI / Divergence
RSI length โ default 14.
High-OI level / Low-OI level โ default 70 / 30.
Fractal period n โ default 2 (swing width).
Fractals to compare โ how many past swings to scan, default 3.
Max visible arrows โ keeps last 50 BUY/SELL arrows for speed.
Funding Rate
mode โ choose FR, Avg Premium, Premium Index, Avg Prem + PI or FR-candle.
Visual scale (ร) โ multiplies raw funding to fit 0-100 oscillator scale (default 10).
specify symbol โ enable only if funding symbol differs from chart.
use lower tf โ averages 1-min premiums for smoother intraday view.
show table โ tiny two-row widget at chart edge.
Signal Filter
Use Funding filter โ ON hides long signals when funding > Buy-threshold and short signals when funding < Sell-threshold.
BUY threshold (%) โ default 0.00 (raw %).
SELL threshold (%) โ default 0.00 (raw %).
(Enter funding thresholds as raw percentages, e.g. 0.01 = +0.01 %).
3โVisual Outputs
Sub-pane
Aqua OI-RSI curve with 70 / 50 / 30 reference lines.
Funding visualised according to selected mode (green above 0, red below 0, or other).
BUY / SELL arrows at oscillator extremes.
Price chart
Identical BUY / SELL arrows plotted with force_overlay = true above/below candles that formed qualifying fractals.
Optional table
Shows current asset ticker and latest funding value of the chosen mode.
4โSignal Logic (Summary)
Load _OI series and compute RSI.
Retrieve Funding-Rate + Premium Index (optionally from lower TF).
Find fractal swings (n bars left & right).
Check divergence:
Bearish โ price HH + OI-RSI LH.
Bullish โ price LL + OI-RSI HL.
If Funding-filter enabled, require funding < Buy-thr (long) or > Sell-thr (short).
Plot arrows and trigger two built-in alerts (Bearish OI-RSI divergence, Bullish OI-RSI divergence).
Signals are fixed once the fractal bar closes; they do not repaint afterwards.
5โHow to Use
Attach to a liquid perpetual-futures chart (BTC, ETH, major Binance contracts).
If _OI or funding series is missing youโll see an error.
Choose timeframe:
15 m โ 4 h for intraday;
1 D+ for swing trades.
Lower TFs โ more signals; raise Fractals to compare or use Funding filter to trim noise.
Trade checklist
Funding positive and rising โ longs overcrowded.
Price makes higher high; OI-RSI makes lower high; Funding above Sell-threshold โ consider short.
Reverse logic for longs.
Combine with trend filter (EMA ribbon, SuperTrend, etc.) so you fade only when price is stretched.
Automation โ set TradingView alerts on the two alertconditions and send to webhooks/bots.
Performance tips
Keep Max visible arrows โค 50.
Disable lower-TF premium aggregation if script feels heavy.
6โLimitations
Some symbols lack _OI or funding history โ script stops with a console message.
Binance Premium Index begins mid-2020; older dates show na.
Divergences confirm only after n bars (no forward repaint).
7โChangelog
v1.0 โ 10 Jun 2025
Initial public release.
Added price-chart arrows via force_overlay.
Apex Edge โ Super RSIThe Apex Edge โ Super RSI is not your average RSI. This is an institutional-grade signal engine designed for serious traders who want confluence, control, and confidence โ all wrapped into one visual powerhouse.
โโโโโโโโโโโโโโโโโโโโ
KEY FEATURES
โโโโโโโโโโโโโโโโโโโโ
โ **RSI + Divergence Engine**
โโข Classic & Hidden Divergences (auto-detected)
โโข Labelled with shapes:
โโโฒ Green Triangle โ Buy Signal (strength-based size)
โโโผ Red Triangle โ Sell Signal
โโโ Green Diamond โ Classic Bullish Divergence
โโโ Red Diamond โ Classic Bearish Divergence
โโโ Green Circle โ Hidden Bullish Divergence
โโโ Red Circle โ Hidden Bearish Divergence
Note - Users can edit symbol colours in settings for better clarity
โ **Trap Detection System**
โโข Detects low-move, high-signal clusters (liquidity traps)
โโข Automatically suppresses signals for X bars after detection
โโข Trap zones shown with shaded background (optional)
โ **Signal Scoring Logic**
โโข Each signal is scored 1โ6 based on:
โโโข RSI Threshold Break
โโโข RSI Slope
โโโข Divergence Detected
โโโข Trap Avoidance
โโโข Multi-Timeframe Confluence (optional)
โโข The plotted shape size reflects the strength of the entry signal
โ **Multi-Timeframe Confluence (MTF)**
โโข Optional filter that uses HTF and VHTF RSI alignment
โโข Prevents countertrend signals
โโข MTF Bias shown on HUD panel
โ **Always-On HUD Panel**
โโข Displays:
โโโข Signal Type
โโโข Signal Score
โโโข Divergence Type
โโโข RSI (LTF & HTF)
โโโข Trap & Cooldown Status
โโโข MTF Bias
โโโข Volatility %
โ **Alert Ready**
โโข Buy/Sell alerts
โโข Trap Detected alert
โโข Divergence alert with dynamic message
โโข Perfect for webhook integrations
โโโโโโโโโโโโโโโโโโโโ
๐ HOW TO TRADE IT
โโโโโโโโโโโโโโโโโโโโ
โ
**Buy Setup**
โโข Green triangle (โฒ) appears **below bar**
โโข RSI is oversold and rising
โโข HTF RSI agrees (optional)
โโข Signal score is 3+ for best confidence
โโข Avoid signals during cooldown zone
โ
**Sell Setup**
โโข Red triangle (โผ) appears **above bar**
โโข RSI is overbought and falling
โโข HTF RSI agrees (optional)
โโข Signal score is 3+ for best confidence
โ
**Divergences**
โโข Use diamonds/circles to identify momentum shifts
โโข Strongest when aligned with score 4โ6
โ**Trap Zones**
โโข When background is shaded, wait for cooldown
โโข Signals during traps are suppressed for safety
โโโโโโโโโโโโโโโโโโโโ
๐ BEST USED WITH
โโโโโโโโโโโโโโโโโโโโ
๐น Apex Edge โ Session Sweep Pro (to visualize liquidity levels)
๐น Volume Profile or OBV (volume-based confirmation)
๐น EMA Ribbon (for trend alignment)
๐น Fair Value Gap indicator (smart money models)
โโโโโโโโโโโโโโโโโโโโ
๐ง PRO TIPS
โโโโโโโโโโโโโโโโโโโโ
โข Use the HUD for decision confidence โ if everything aligns, youโve got an Apex-grade setup.
โข Wait for candle close to confirm divergence-based entries.
โข Score 5โ6 = sniper entries. Score 1โ2 = warning shots.
This indicator can be used alongside Apex Edge Session Sweep Pro for better visual clarity.
โโโโโโโโโโโโโโโโโโโโ
ยฉ Apex Edge | All rights reserved.
3 days ago
Release Notes
Update - Added a toggle to show/hide HUD when using on smaller mobile devices so as not to clutter the screen.
Market Signals ComplexMIC is an indicator made from some standard deviations of Bollinger Bands, an EMA ribbon, some oscillators like the RSI, and some candlestick patterns like Bearish and Bullish Engulfing candles. It uses these parameters to help you trade/find high-interest zones in the short time as well as the long term. It can be used in any market.
MASEMAS All-In-One V2.0This is an indicator for those with a free account and have a low maximum of active indicators at once.
V2.0 contains:
- 3 Simple Moving Averages + 5 Exponetial Moving Averages.
- EMA Ribbon (Credits to as I literally copy/pasted his work).
- Auto Fibonacci Levels!
MASEMAS All-In-OneAll-In-One (Work in progress)
This is an attempt to create an All-In-One indicator for those who have a free account with a limited amount of indicators.
V. 1.0 contains:
- 3x Simple Moving Averages + 5x Exponential Moving Averages (a.k.a. my indicator "MASEMAS")
- EMA Ribbon
- Auto Fibonacci Retracement
All-In-One [KryptoKoning]All-In-One (Work in progress)
This is an attempt to create an All-In-One indicator for those who have a free account with a limited amount of indicators.
V. 1.0 contains:
- 3x Simple Moving Averages + 5x Exponential Moving Averages (a.k.a. my indicator "MASEMAS")
- EMA Ribbon
- Auto Fibonacci Retracement


